Monday, February 10, 2014

Guarding enumeration classes from ProGuard

During my application tests I received exception with the following call stack:
02-09 15:18:06.478 26166 26403 E TAG: Caused by: java.lang.NullPointerException
02-09 15:18:06.478 26166 26403 E TAG:   at java.lang.Enum$1.create(Enum.java:43)
02-09 15:18:06.478 26166 26403 E TAG:   at java.lang.Enum$1.create(Enum.java:35)
02-09 15:18:06.478 26166 26403 E TAG:   at libcore.util.BasicLruCache.get(BasicLruCache.java:54)
02-09 15:18:06.478 26166 26403 E TAG:   at java.lang.Enum.getSharedConstants(Enum.java:209)
02-09 15:18:06.478 26166 26403 E TAG:   at java.util.EnumSet.noneOf(EnumSet.java:48)
02-09 15:18:06.478 26166 26403 E TAG:   at af.a(SourceFile:115)
The exception occurred only in release version, while in debug everything worked fine. So I immediately suspected that ProGuard, whose processing is part of a release build, is somehow involved here.

From ProGuard's documentation:
If your application, applet, servlet, library, etc., contains enumeration classes, you'll have to preserve some special methods. Enumerations were introduced in Java 5. The java compiler translates enumerations into classes with a special structure. Notably, the classes contain implementations of some static methods that the run-time environment accesses by introspection (Isn't that just grand? Introspection is the self-modifying code of a new generation). You have to specify these explicitly, to make sure they aren't removed or obfuscated: 
-keepclassmembers,allowoptimization enum * {
      public static **[] values();
      public static ** valueOf(java.lang.String);
}
OK, problem found: I just need to add this 'keepclassmembers' exception in ProGuard project configuration file.

But what are values() and valueof(java.lang.String) needed for? I still was curious how exactly I received NullPointerException in java.lang.Enum entrails. Let's better understand it.

Monday, February 3, 2014

Programmatically filtering your application's logs from Logcat output

Note: this post discusses filtering Logcat output on devices running Android prior to version 4.1. Starting from Android 4.1 applications are allowed to read only their own logs.

Logcat isn't much convenient when it comes to filtering your application logs. In fact, if you look at the logcat documentation, you will find that you can filter logcat output only by priority and/or tag fields:
A filter expression follows this format tag:priority ..., where tag indicates the tag of interest and priority indicates the minimum level of priority to report for that tag. Messages for that tag at or above the specified priority are written to the log. You can supply any number of tag:priority specifications in a single filter expression. The series of specifications is whitespace-delimited.
The android.util.Log class is your interface for printing your application logs to the Logcat system. Common print statement looks like this:
Log.e(TAG, "something bad happened");
Invoked method specifies the priority of the log record - in this example e stands for error, and TAG specifies well.. the tag.
 I commonly set the class name as a TAG using this statement:
private static final String TAG = ClassName.class.getCanonicalName();
Resolving the class name at run-time allows me to stay flexible and be adjusted to all the obfuscations made by Proguard processing.

But here's a problem: given a project with a hundred classes, how would you filter Logcat's output to print just your application's logs?

Saturday, February 1, 2014

Solving errors in Android Studio's new project creation

The other day I upgraded my Android Studio bundle to latest stable version: android-studio-bundle-132.893413-windows.

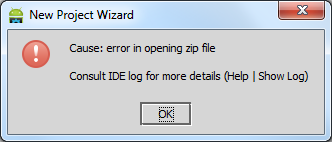
Shortly afterwards, I noticed that each time I tried to create a new project, it ended with the following error message:
Cause: error in opening zip file. Consult IDE log for more details (Help | Show Log)


Hmmmm.. which error file exactly and what's wrong with it?

Saturday, July 13, 2013

Exporting Google Chrome's page load metrics

Google Chrome offers a rich functionality as it comes to a developer productivity. Pressing F12 opens the developer tools window with eight panels of tools, allowing you to inspect DOM elements and styles, various resources (DB, cookies, appcache, local storage, etc) and network statistics; debug JavaScript code; running commands in the shell console and many more.


Recently, I've been experimenting with several network configurations, and wanted to log page load in order to do a benchmark later on. At the very least, I wanted to log each page load - how much time in total it took to load the page. The Network panel in developer tools provides that information for a view only (can be found in the very bottom of the page).

Saturday, July 7, 2012

Keylogging with Win32 Hooks

Keylogger (from Wikipedia):
Keystroke logging is the action of tracking (or logging) the keys struck on a keyboard, typically in a covert manner so that the person using the keyboard is unaware that their actions are being monitored.

It may seem strange, but there're many keylogging methods. People are getting more inventive as it comes to obtaining other people's secrets.
Protecting your secrets becomes challenging task. Even more than you can think of. Depending on your level of paranoia, perhaps you have to make sure that:
  • you're not using wireless keyboards
  • your keyboard installed directly into computer, and that there's no external device attached in between
  • you're using silent keyboard for preventing acoustic cryptanalysis attacks, and if you don't have one - you have to install random keypress sound generating machine
And I didn't even mention software-based threats!

Typical keylogger paranoid
Read the following excellent article, written by Nikolay Grebennikov, current CTO of Kaspersky Lab, where he outlines keylogger history including several publicized keylogging incidents.

Monday, April 30, 2012

Simple Structured Exception Handling (SEH) Exploit Example

In this post I will demonstrate how to exploit Structured Exception Handling (SEH) buffer overflow vulnerability on x86 systems.

What is Structured Exception Handling and how it works?

Microsoft's Structured Exception Handling is a mechanism for handling hardware and software exceptions (both system and user defined), which allows recovering from errors and perform cleanup if necessary instead of terminating a program immediately.

The SEH represented as a linked list, whose records are stored on the stack. To ease access to this SEH chain, its head pointer maintained in Win32 Thread Information Block (TIB) structure. The TIB structure stores information about currently running thread. On x86 systems, the FS segment register points on TIB structure. SEH chain head located at offset 0x00, and therefore, you can refer to SEH chain head as FS:[0].

Each entry (_EXCEPTION_REGISTRATION_RECORD structure) consists from two 4-byte pointers:
  1. Pointer to the next exception registration record in the chain
  2. Pointer to the exception handling routine
The chain's last record always contains 0xFFFFFFFF value as the "next entry" and pointer to OS default exception handler routine (located in ntdll.dll!FinalExceptionHandler)

Saturday, April 14, 2012

Return-Oriented Programming (ROP) Exploit Example

In this post I will show a simple vulnerability exploitation example using return-oriented programming (ROP) technique.


Motivation

You found stack buffer overflow vulnerability in a program, but the target environment protected with Hardware-enforced Data Execution Prevention (DEP) mechanism. Briefly speaking, this security feature allows marking certain parts of memory as non-executable, i.e. stack or heap memory pages.

Therefore you can't just overwrite the saved eip address with jmp esp instruction and execute the shellcode from the stack (attempting to run code from the stack will cause a STATUS_ACCESS_VIOLATION exception).


Return-Oriented Programming (ROP) technique

This technique uses existing instruction sequences from loaded modules. No function calls, no any other intentionally placed instructions execution! Because all the executed instructions are located at executable memory pages, this allows us to bypass Hardware-enforced DEP mechanisms.

Shacham et al. state that ROP, given any sufficiently large codebase to draw on, is a Turing-complete exploit language, which means that it can simulate any other language.
More information, including historical facts and detailed explanation, can be found in these slides.